Recovering data from broken appliance VMDKs

Once in a while, a customer may give you a virtual disk image for an appliance that needs to be analyzed over the course of an incident response engagement. At G DATA ADAN we’re typically not fans of full disk imaging due to the time it takes and the logistics it involves, but sometimes it cannot be avoided – especially if the system in question does not boot properly anymore, or if it’s a specialized system where we don’t know in advance what data exactly we’d like to be collected.

VMDK is short for Virtual Machine Disk and is a format that was established by VMware. It used to be a proprietary format, but in 2011 its specification was opened up because it became one of the formats that can be used for disks in the Open Virtualization Format (OVF), which is used for sharing/exchanging virtual machines across virtualization solutions.

One might be tempted to think that all files ending with a .vmdk extension have the same structure internally, but it turns out this is not the case. Some VMDK files are “flat images”, which means they’re bit-by-bit representations of the stored disk without any extra header/footer. The descriptor for such files is likewise stored as a small .vmdk file containing only the descriptor. Then, there’s sparse files that have a header beginning with the VMDK magic (little endian, so KDMV as ASCII sequence). ESXi also stores snapshots as .vmdk files, which will have a COWD header magic (copy-on-write disk). As you can see, saying “it’s a .vmdk file” doesn’t reveal much in regards to what we’re dealing with, and it greatly depends on context what specifically one will find in the image.

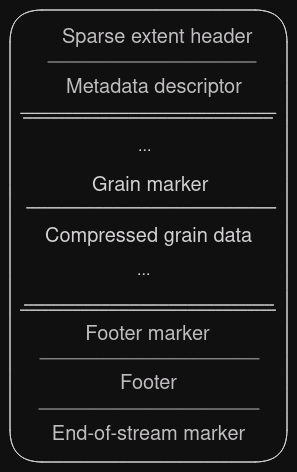
After that short primer, back to our case: The virtual appliance provided by the customer had a problem. It was not possible to import it with official VMware tooling (fails at 99%), and open-source tooling such as qemu-img complains about an “invalid footer”. Our first guess was that the file was somehow corrupted or perhaps encrypted, since it has a high entropy. A quick look at the file’s hex representation revealed that we’re dealing with the KDMV variant. This is fully described in a document titled Virtual Disk Format 5.0 that can be found on the Internet (vmdk_50_technote.pdf). In particular, we’re dealing with a Hosted Sparse Extent Header in the first sector. This structure contains many interesting fields such as total capacity, size of metadata at the beginning of the file, and compression algorithm. The only supported algorithm is Deflate, and that’s what our file happens to be using – which explains the entropy that we saw.

The rest of the file contains so-called Stream-optimized compressed extents, which are basically chunked compressed disk sectors called grains, sometimes interspersed with metadata/tables to aid seeking for specific sectors. The format was designed for network streaming, e.g., from an NFS share. The documentation reveals that it’s also supposed to have a footer (simply a copy of the initial sector containing the KDMV header) and an end-of-stream marker (effectively an all-zero sector). Those two things appear to be missing in our file, since it seemingly ends in the middle of compressed data. This in turn means the file is an incomplete copy.

Structure diagram visualizing the header, (repeating) markers and footer.
Schematic of the format structure.

It’s unclear whether something happened to the appliance in the customer’s infrastructure that caused its disk to be truncated, or if this is a result of an incomplete export to external media. We could of course now go and bug the customer and ask them to check this and provide us with the data again, but that would be slightly annoying for everyone involved. And after all, we have over 300 GB of compressed data, surely something can be done?

Given the truncation, all official tools and libraries will refuse to open this image. This is understandable for a normal scenario, because it’s better to fail instantly rather than having the user attempt to mount an incomplete disk, which could very well cause inexplicable errors down the line.

Working in a forensics environment, one is somewhat used to having incomplete data or other cases where things went awry and were left in an inconsistent state. We’re no strangers to carving and given the data that we have, it should be possible to get something usable out of it. In other words, “yes, we know it’s an incomplete image, just give us everything you have”.

Time for custom tooling! We need to:

  1. Inspect the file header and ensure it’s indeed a format we understand.
  2. Skip the header/metadata so that we’re at the position of the first actual grain.
  3. Read grains and decompress them until we reach the end of the file. Skip any other markers such as grain tables, we don’t need them because we’re doing a full sequential read.
  4. Write decompressed data to an output file as we go, in the end yielding a flat disk image.

Should be simple enough, right? In fact, implementing this was relatively straight-forward. The documentation helpfully provides C structs that can be copied without modification. Other than that, mostly some file I/O code and handling of zlib for decompression is required.

Caveats:

  • Struct members of type SectorType need to be multiplied by 512 to obtain a value in bytes. It’s not entirely clear whether this sector size is always used, but for the time being we treat it as a constant.
  • Grains are aligned to sector boundaries, meaning most of the time a seek is required after reading the compressed data. The rare case that you end up exactly on a sector boundary does happen, though!
  • Remember it’s a sparse file, so not all sectors are represented in the image. If there’s a gap in the sector numbers from one grain to the next, zeroes need to be written to the output file in order to account for the sparse sectors.

We’ve open sourced the tool in case someone else ever finds themselves in this situation. You can find it on GitHub.

The tool worked well and produced a 1 TiB raw image from a ~300 GiB input VMDK. In the end around 12.5 GiB were missing from the raw image, which isn’t all that much, relatively seen. So it was our hope that no data of importance was lost (i.e., mostly empty space at the end of the disk) and that we could bring it into a mountable state.

Once again, we checked the hex representation of the first few sectors of the newly produced image to see if we can figure out at a glance what we’re dealing with. Indeed, an LVM2 magic quickly made itself seen. However, trying to activate the volume group…

Meme about LVM complaining about the missing sectors
If you give it a truncated disk, LVM will taunt you.
$ vgscan
WARNING: Device /dev/loop49 has size of 2074520165 sectors which is smaller than corresponding PV size of 2097152000 sectors. Was device resized?
WARNING: One or more devices used as PVs in VG foobarvg have changed sizes.
Found volume group "foobarvg" using metadata type lvm2

The volume group foobarvg (name changed) was found, but it doesn’t like the reduced size at all. While the scan command just emits a warning, trying to activate the group with vgchange -ay faults with an invalid argument error.

What can we do? Well, not much. All we can do is try to set the image size to the proper size (essentially padding the file) and hope LVM will be appeased. Multiplying the PV size output by the command above by 512 will yield a number in bytes that can be passed to truncate -s, which will fill up the file with zeroes to the specified size. This by the way matches the number of sectors that was also given in the VMDK header as capacity.

With the size adjustment in place, the volume group can be activated successfully and we found it to contain a single logical volume. This in turn is an ext4 partition, but mounting it at first failed with a “bad superblock” error. We feared for the worst – however, the dumpe2fs tool was able to display proper information about the filesystem with no obvious errors, meaning it couldn’t have been completely broken. Running fsck on the partition found a couple metadata errors that it was able to fix, and afterwards we were able to mount it without issues. My colleague Backi brought a tool called xmount to my attention that enables one to have a writable “virtual” disk image backed by a write cache (basically a copy-on-write mechanism using FUSE). That way we could use fsck without modifying the dumped VMDK image that took over an hour to create – just in case something went wrong.

We were finally able to access the relevant log data of the appliance and didn’t even have to resort to actual carving. Hooray!

Config Extraction from in-memory CobaltStrike Beacons

Recently we had a case where threat actors deployed CobaltStrike, which has become a common pattern over the years. CobaltStrike is a tool designed for red teaming exercises and provides a foothold into a target environment as well as extensive capabilities for staging further payloads. Unfortunately it is abused for malicious purposes just as often.

While doing forensic analysis of compromised systems, our Incident Response team is interested in how exactly CobaltStrike is configured. Having the configuration can give context to why certain operations were carried out, such as domains being contacted or processes being launched as a code injection target. There are more than a handful of public tools that extract the config, however we had a special situation in our particular case: We didn’t have the original payload used to launch the beacon. Often, threat actors are careless and drop it to disk or there are PowerShell logs that contain an encoded version of the beacon – none of that was the case here. The customer has an EDR solution that gave us insight into suspicious activities carried out by processes, which allowed us to figure out which process CobaltStrike was injected into. One of the first things we tell a customer during an incident is not to shutdown/reboot any machines, and luckily that advice was followed in this case. We were able to obtain RAM dumps of the compromised systems, and we could then use Volatility to generate dumps for those processes that were apparently running malicious code.

When working with such a memory dump, two problems present themselves:

  1. How to find the beacon code in memory?
  2. Once found, how to extract its config?

A YARA scan for known CobaltStrike signatures has come up empty. However, Volatility contains a module called “malfind” which looks for memory pages that are both executable and writable. You’ll typically only find that when malware is involved, or possibly if code is generated dynamically, e.g., by a Just-In-Time compiler. As it happens, our process of interest had exactly one match for that condition. It pointed to an area of memory spanning around 400 KB of high entropy data. Towards the end of the area there was a repeating sequence that suspiciously looked like XOR masking had been applied to a bunch of zeroes. Indeed, we were able to unmask the entire area using the repeating sequence as key. If this is the beacon we were looking for, how can it be that it is completely masked? After all, XORed code cannot be in a state of execution?!

It turns out CobaltStrike has a feature called “sleep mask”, which obfuscates its PE sections in memory while there are no tasks to execute. At a set interval, it will wake up, contact the C2 server to query for any tasks to execute, and then go back to sleep. Typically this will only take a few dozen milliseconds, so it is rather unlikely a dump is created in exactly the right moment while everything is decrypted. A small piece of code that is never masked is responsible for orchestrating the mask-sleep-unmask cycle. This feature can be customized to also include important heap areas, e.g., so that important strings such as the C2 domain are not visible in memory dumps.

As for the second point, you might think, “well, once you’ve extracted the beacon, just use one of the config extraction tools”. Sadly, it’s not that easy. One of the first things CobaltStrike does after starting is loading its embedded config and “unpacking” it into heap memory. The packed config is then overwritten with zeroes. What do nearly all tools out there look for? You guessed it, the packed config. We found one tool that can deal with unpacked configs (note: our search was probably non-exhaustive), however it is 32-bit only while our beacon is 64-bit, and it cannot deal with Volatility dumps, nor with the masking aspect.

We jerry-rigged some code that can deal with our particular situation, but first let’s talk about the config data structures that we’re dealing with. Packed beacon configs follow a sort of type-length-value (TLV) format:

  • 16-bit ID specifying the meaning of the entry – e.g., 8 is the C2 server the beacon will talk to
  • 16-bit kind: 1 (16-bit value), 2 (32-bit value) or 3 (binary blob)
  • 16-bit length: Length of the data value that follows
  • Variable-length bytes for the actual data

All integers are encoded in big endian. Additionally, the entire packed config blob is XORed with a single byte key (0x2E by default).

At runtime, CobaltStrike turns this into a slightly different data structure that allows more efficient access. The unpacked config is an array of two machine words (so either 2x 32-bit or 2x 64-bit). The array index is the entry ID, the first word is the value kind (1/2/3) or 0 if the entry is empty, and the second word is either the data value for kinds 1 & 2 (now in little endian), or a pointer to the binary data in case of kind 3. The memory for the binary data is dynamically allocated using malloc, and the same is true for the array itself. The pointer to the array is kept in the beacon’s data section, so that code working with the config can locate it. The following illustration shows the different data locations and references to them:

Overview of involved memory locations

The observant reader might be wondering what happened to the length value for binary values. Indeed, it is not stored in the unpacked config. Since CobaltStrike knows what type of value it’s accessing, it has its own mechanisms for determining the appropriate data length without explicitly being told the length. Most data such as strings uses zero-termination, but if you consider an ASN.1-encoded public key for example, it has the length built into its format.

Upon closer inspection, we noticed the length is not completely lost. The beacon keeps a list of heap pointers and their size, and the config binary entries are added to that list. We suspect this list is given to the sleep mask functionality so that it can obfuscate “important” heap data. In fact, in our case the unpacked config allocation and all allocations for config binary values are masked individually, supporting that hypothesis.

Keeping all of the above in mind, a plan for dealing with this could look as follows:

  1. Manually find, extract and unmask the CobaltStrike beacon from the Volatility process dump. We used malfind, dd and CyberChef for this step. If you need to know the size to copy out of the process dump, scroll down in the memory map starting from the address given by malfind, until you notice a gap in the virtual addresses
  2. Use a regex to search for the data section reference in the config processing code, read the pointer from the data section
  3. Unmask the unpacked config heap memory
  4. Read up to 128 entries from the config array (for a 64-bit beacon, the allocation is 2048 bytes, which is 128*16). For binary values (kind 3), read and unmask the heap memory they point to
  5. Throw the resulting data into one of the existing CobaltStrike config parsers to get a readable output

Here’s an example memmap output. 0x1c451690000 is the address found by malfind, 0x1c451800000 marks a gap, so the beacon spans from 0x877000 up until 0x8fd000 in pid.XXXX.dmp.

virt		phys		size	file offset	filename
0x1c451690000	0xbd6e8000	0x1000	0x877000	pid.XXXX.dmp
0x1c451691000	0xacdeb000	0x1000	0x878000	pid.XXXX.dmp
0x1c451692000	0x350ec000	0x1000	0x879000	pid.XXXX.dmp
... cut for brevity
0x1c451713000	0x3ef6d000	0x1000	0x8fa000	pid.XXXX.dmp
0x1c451714000	0x1208ea000	0x1000	0x8fb000	pid.XXXX.dmp
0x1c451715000	0x384e9000	0x1000	0x8fc000	pid.XXXX.dmp
0x1c451800000	0x6c1e6000	0x1000	0x8fd000	pid.XXXX.dmp

Check out our GitHub Gist for an implementation of steps 2 through 4. You need the following files/information:

  • Volatility process dump
  • Volatility memmap command output containing the memory map for the dump (so that virtual addresses can be mapped to offsets in the dump file)
  • Beacon extracted & unmasked manually in step 1
  • XOR key for unmasking (note: the rotation of this key can differ to the one you used in step 1, so try to rotate the bytes if it doesn’t work immediately)

The Volatility command to create a full process dump is python vol.py -f /path/to/ram-dump windows.memmap.Memmap --pid 12345 --dump > memmap.txt.

The provided code is not an end-to-end solution since there are still manual steps and we didn’t include a CobaltStrike config parser for the final step, but perhaps you will find it helpful if you run into a similar case.